
Wednesday, September 8, 2010


Demand And Supply
Market : A group of buyers and sellers of a particular good or service.
Competitive Market : A market in which there are many buyers and many sellers so that each has a negligible impact on the market price.
Competition: Perfect and Otherwise:
Characteristics of a perfectly competitive market:
- The goods being offered for sale are all the same.
- The buyers and sellers are so numerous that none can influence the market price.
- Because buyers and sellers must accept the market price as given, they are often called “price takers.”
- Agricultural market provide good example of perfect competition.
- A market with only one seller is called a monopoly market.
- A market with only a few sellers is called an oligopoly.
- A market with a large number of sellers, each selling a product that is slightly different from its competitors’ products, is called monopolistic competition.
Demand:
- Quantity Demanded: the amount of a good that buyers are willing and able to purchase.
- Law of Demand: the claim that, other things being equal, the quantity demanded of a good falls when the price of the good rises.
Factors:
1. Price: Quantity demanded is negatively related to price. This implies that the demand curve is downward sloping.
2. Income: The relationship between income and quantity demanded depends on what type of good the product is.
- Normal Good: a good for which, other things equal, an increase in income leads to an increase in demand.
- Inferior Good: a good for which, other things equal, an increase in income leads to decrease in demand.
3. Prices of Related Goods
- Substitutes: two goods for which an increase in the price of one good leads to an increase in the demand for the other good.
- Complements: two goods for which an increase in the price of one good leads to a decrease in the demand for the other good.
4. Tastes and Preferences:
5. Expectations: This could include expectations of future income or expectations of future price changes.
The Demand Schedule and the Demand Curve:
- Demand Schedule: a table that shows the relationship between the price of a good and the quantity demanded.
- Demand Curve: a graph of the relationship between the price of a good and the quantity demanded.
Market Demand Versus Individual Demand:
- The market demand is the sum of all of the individual demands for a particular good or service.
- The demand curves are summed horizontally — meaning that the quantities demanded are added up for each level of price.
- The market demand is the sum of all of the individual demands for a particular good or service.
- The demand curves are summed horizontally — meaning that the quantities demanded are added up for each level of price.
- The market demand curve shows how the total quantity demanded of a good varies with the price of the good.
- Quantity Supplied: the amount of a good that sellers are willing and able to sell.
1. Price: Quantity supplied is positively related to price.
Law of Supply: the claim that, other things equal, the quantity supplied of a good rises when the price of the good rises.
2. Input Prices
3. Technology
4. Expectations
Market Supply Versus Individual Supply:
- The market supply curve can be found by summing individual supply curves.
- Individual supply curves are summed horizontally at every price.
- The market supply curve shows how the total quantity supplied varies as the price of the good varies.
Shifts in the Supply Curve:
1. When any determinant of supply changes (other than price), the supply curve will shift.
2. An increase in supply can be represented by a shift of the supply curve to the right.
3. A decrease in supply can be represented by a shift of the supply curve to the left.
Equilibrium (Demand & Supply are equal): The point where the supply and demand curves intersect is called the market’s equilibrium.
- Equilibrium: a situation in which supply and demand has been brought into balance.
- Equilibrium Price: the price that balances supply and demand.
- The equilibrium price is often called the “market-clearing” price because both buyers and sellers are satisfied at this price.
- Equilibrium Quantity: the quantity supplied and the quantity demanded when the price has adjusted to balance supply and demand.
- If the actual market price is higher than the equilibrium price, there will be a surplus of the good.
Surplus: a situation in which quantity supplied is greater than quantity demanded.
- To eliminate the surplus, producers will lower the price until the market reaches equilibrium.
- If the actual price is lower than the equilibrium price, there will be a shortage of the good.
- Shortage: a situation in which quantity demanded is greater than quantity supplied.
- Sellers will respond to the shortage by raising the price of the good until the market reaches equilibrium.
Law of Supply and Demand: the claim that the price of any good adjusts to bring the supply and demand for that good into balance.

Thinking Like an Economist
ECONOMICS a SCIENCE & POLITICS: The essence of Science however, is the scientific method – the dispassionate development and testing of theories about how the world works.
• The interplay between theory and observation also occurs in the field of Economics.
• The theory might assert that high Inflation arises when the government prints too much money.
• It gets proved when Economist collects and analyzes data on prices and money from country.
• Theory & Observation like science, they do face an obstacle that makes their task especially challenging.
• Experiments are often difficult in Economics – thus shows the sign of politics. A scenario of unanticipation.
THE ROLE OF ASSUMPTIONS:
• Making an assumption greatly simplifies the problem without substantially affecting the answer.
• Assumptions can make the world easier to understand.
• For Instance, once we understand International trade in an imaginary world with two countries and two goods, we are in a better position to understand International trade in the more complex world in which we live.
• Assumptions help knowing the magnitude of at least two or more variables impact in the given Economy.
ECONOMIC MODELS:
• The doctors use major plastic organs like – the heart, liver, kidneys etc. to explain how the body organs functions.
• Likewise, Economist also uses models to learn about the world, but instead of being made of plastic, they are most often composed of diagrams and equations.
• “Models are structures involving relationships among concepts”
• Economic models omit many details to allow us to see what is truly important.
The Circular-Flow Model: The circular-flow model is a simple way to visually show the economic transactions that occur between households and firms in the economy.
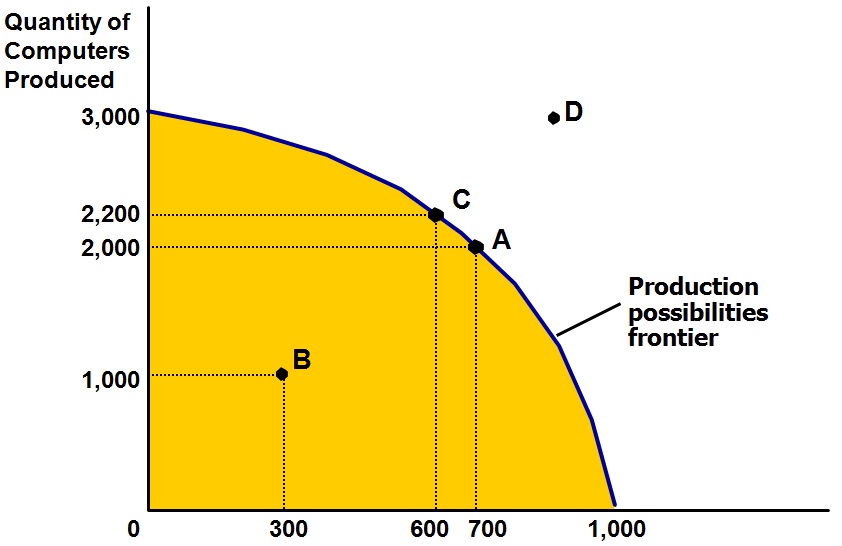
The Production Possibilities Frontier: The production possibilities frontier is a graph showing the various combinations of output that the economy can possibly produce, given the available factors of production and technology.
Microeconomics and Macroeconomics:
- Microeconomics focuses on the individual parts of the economy. How households and firms make decisions and how they interact in specific markets
- Macroeconomics looks at the economy as a whole. How the markets, as a whole, interact at the national level.
Two Roles of Economists: When they are trying to explain the world, they are scientists. When they are trying to change the world, they are policymakers.
- Positive statements are statements that describe the world as it is. Called descriptive analysis.
- Normative statements are statements about how the world should be. Called prescriptive analysis.
Wednesday, September 1, 2010
Subscribe to:
Posts (Atom)